Income Mobility
General Summary on Income Mobility:
Two forms of mobility: relative and absolute. This section focuses primarily on relative mobility.
There are periods of low and high relative and absolute income mobility in the US.
There was considerable income mobility of individuals in the U.S. economy during the 1996 through 2005 period as over half of taxpayers moved to a different income quintile over this period. Link
This study examined income mobility of individual taxpayers age 25 and over for the period from 1996 through 2005 using information reported on individual income tax returns. The key findings are that there was considerable income mobility of individuals in the U.S. economy during the 1996 through 2005 period and that the degree of income mobility among income groups is unchanged from the prior comparable period (1987 through 1996).
There are also many barriers that have grown against upward mobility, as the welfare state grows. The number of weeks of unemployment had grown to 99 weeks, Medicaid income levels have grown, number of people not paying income tax has grown. All point to a perhaps slower upward mobility from the lower quintile in the future.
All of the data here looks at income at pre-tax and pre-transfer payments.
In Europe the mobility is lower as is the Gini coefficient:
About half (50 percent) of parental earnings advantages are passed onto sons in the United States compared to less than 20 percent in high-mobility European countries.
In a fast moving economy going through some structural changes, what should be the income mobility and distribution? No one seems to know. The biases of any author does seem to come to the surface in answering this question.
Important finding: free enterprise does not
correlate with income distribution being askew.
Outline
Income Distribution Page
Chapter 1: Data Sources and Validity
Chapter 2: Income Distribution
Chapter 3: Define Terms like Poor
Chapter 4: Income mobility
Chapter 5: Critical forces acting on us
Chapter 6: The Occupy Movement
Chapter 7: Buffet Rule fair?
Chapter 8: Conclusions
Links on Mobility:
Income Mobility
Rich or Poor: Reason report
Pew Report: Mobility
Congress on Mobility
Middle Class: effects on mobility
Treasury Report on Mobility
Income mobility before 1996
Income mobility from 1980
Income mobility between 1995 and 2005
What does the data say?
The notion of absolute and relative mobility is explained in the video below. The question of how much stickiness exists in any period of time is pertinent and the answer is that it is very dynamic. More data below.
File on Mobility: Link
Sample:
· About half (50 percent) of parental earnings advantages are passed onto sons in the United States compared to less than 20 percent in high-mobility European countries. This means that it takes an average of six generations for family economic advantage to disappear in the United States compared to three generations in Canada, Finland, Norway and Denmark. (‘International’ Figure 2)
· 42 percent of American men born into the poorest fifth of families stay in the bottom fifth of the earnings distribution as adults, compared to 25 to 30 percent in some other countries.
· A smaller percentage of Americans move from the bottom to the top fifth in one generation, than do people in other European countries. Note that Americans making such a climb travel a further distance in absolute dollars than do Europeans because of greater earnings inequality in the United States.
· 36 percent of
children born to parents in the bottom wealth quintile remain in the
bottom as adults, and 36 percent of children born to parents in the
top quintile remain in the top as adults. (‘Wealth’ Figure 8)
· Only 7 percent of children born to parents in the bottom wealth quintile make it to the top quintile in adulthood.
· 35 percent of adult children of parents in the bottom wealth quintile move up to the top 3 quintiles and 41 percent of those born to parents at the top move down to the bottom 3 quintiles.
· Those born to parents in the middle of the wealth distribution have an almost equal likelihood of moving up or moving down a quintile or more.
On economic mobility
Charts on poll results: Shows that 2/3rds feel they are better off than their parents at the same age.
Q: factors likely to contribute to down the ladder: A: ranking showed that the economic conditions was well down the list. Education and life decisions were considered much more important.
From Income Mobility before 1996: Link
The first Treasury study found that 86 percent of taxpayers in the lowest income quintile in 1979 had moved to a higher quintile by 1988 and 15 percent of them had moved all the way to the top quintile.
From 1995 to 2005, Mark Perry writes:
A large majority of today's 1% won't be there in the future, and weren't there in the past, they are just making a temporary stop in that group.
Barriers against Upward Mobility
From page on Middle Class:
Compound that with the most horrifying fact you will read today. A single parent family with income of $14,500.00 actually has more disposable income in the United States than a family earning $60,000.00 a year. Yes, you read that correctly.
The forces operating on all portions of the population will be explored in Chapter 5, by that name. From a mobility standpoint jobs, economic conditions, welfare incentives, growth of single parent families, even changes in the tax structure and economic cycles all come together to affect each quintile differently.
IRS, Treasury on Mobility:
Table at right shows changes from 1979 to 1988: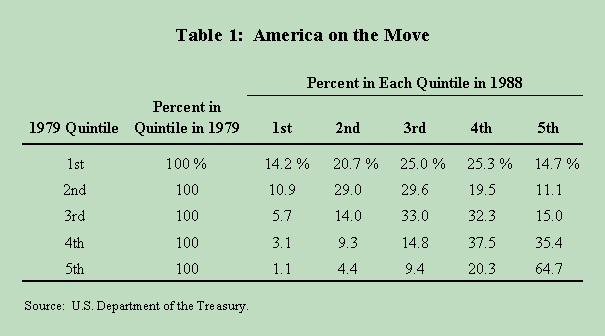
For the very wealthy, the discordant relationship between income and wealth is the result of the dynamic nature of the income reported by this segment of the population. Two studies using panel data from U.S. Federal income tax returns have shown that the composition of the group of individuals whose incomes place them near the top of the income distribution changes dramatically over time (Frenze, 1992; U.S. Treasury, 2007). The U.S. Treasury Department study found, for example, that fewer than half of those in the top 1 percent of the income distribution in 1996 were still in the top 1 percent in 2005.
This volatility increased at the very top of the distribution, so that only about 25 percent of the individuals in the top 1/100th percent in 1996 remained in the top 1/100th percent in 2005. The Treasury report concluded that the income of many of the highest-income taxpayers is transitory and generally declines over time (U.S. Treasury, 2007).
The transitory composition of income quintiles over time can be partially attributed to decreases in wage income for individuals above retirement age. Also, for wealthier individuals, return on capital becomes an increasingly important source of income. For the very wealthy, however, income from capital can be particularly susceptible to manipulation to minimize tax liability. For example, it has been shown that rates of return on investments decline as wealth increases among the very wealthy (Steuerle, 1985; Wahl and Johnson, 2004). If this is the case, then, for these very wealthy individuals, measures of well-being that focus solely on realized income will understate their true economic status.
Some see extreme inequality
Writer clearly sees “extreme inequality in the US”
Five weeks ago the Wall Street Journal (WSJ) commented on a study (pdf) by the Treasury Department on the income mobility of American families. The newspaper proudly reported that 58 percent of households who were in the lowest quintile (the poorest 20 percent) of the income distribution in 1996 had moved to a higher income category by 2005.
Almost 25 percent jumped into the middle or upper-middle income groups, and 5.3 percent made it all the way to the highest quintile. Of those in the second lowest quintile, almost 50 percent moved up and 17 percent moved down. The WSJ’s comment on table 1 stopped there. The evidence was described as "a stunning show of income mobility."
Link to video in answer to these concerns: Link
Talks about mobility, not just inequality. Economic equality is not strongly related to economic freedom.