1996-2005 Income Mobility
Mark Perry writes: Link
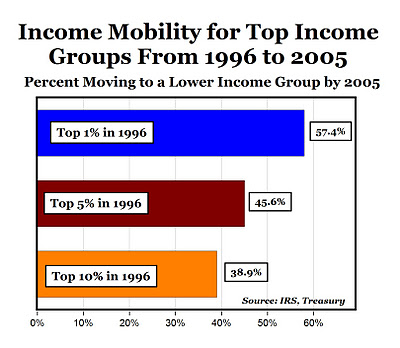
The chart above also shows that almost half (45.6%) of the top 5% in 1996 had moved to a lower income group nine years later in 2005, and roughly 39% of the top 10% in 1996 dropped into a lower income group by 2005.
Whether it's the top 1%, top 5% or top 10%, those income groups are not static, closed groups, but snapshots in just one year of the national income distribution, which is constantly changing over time.
A large majority of today's 1% won't be there in the future, and weren't there in the past, they are just making a temporary stop in that group.