Title of Page
Saez Report - 2008
Summary of this Report
Those at the very top of the income distribution therefore play a central role in the evolution of U.S. inequality over the course of the twentieth century.
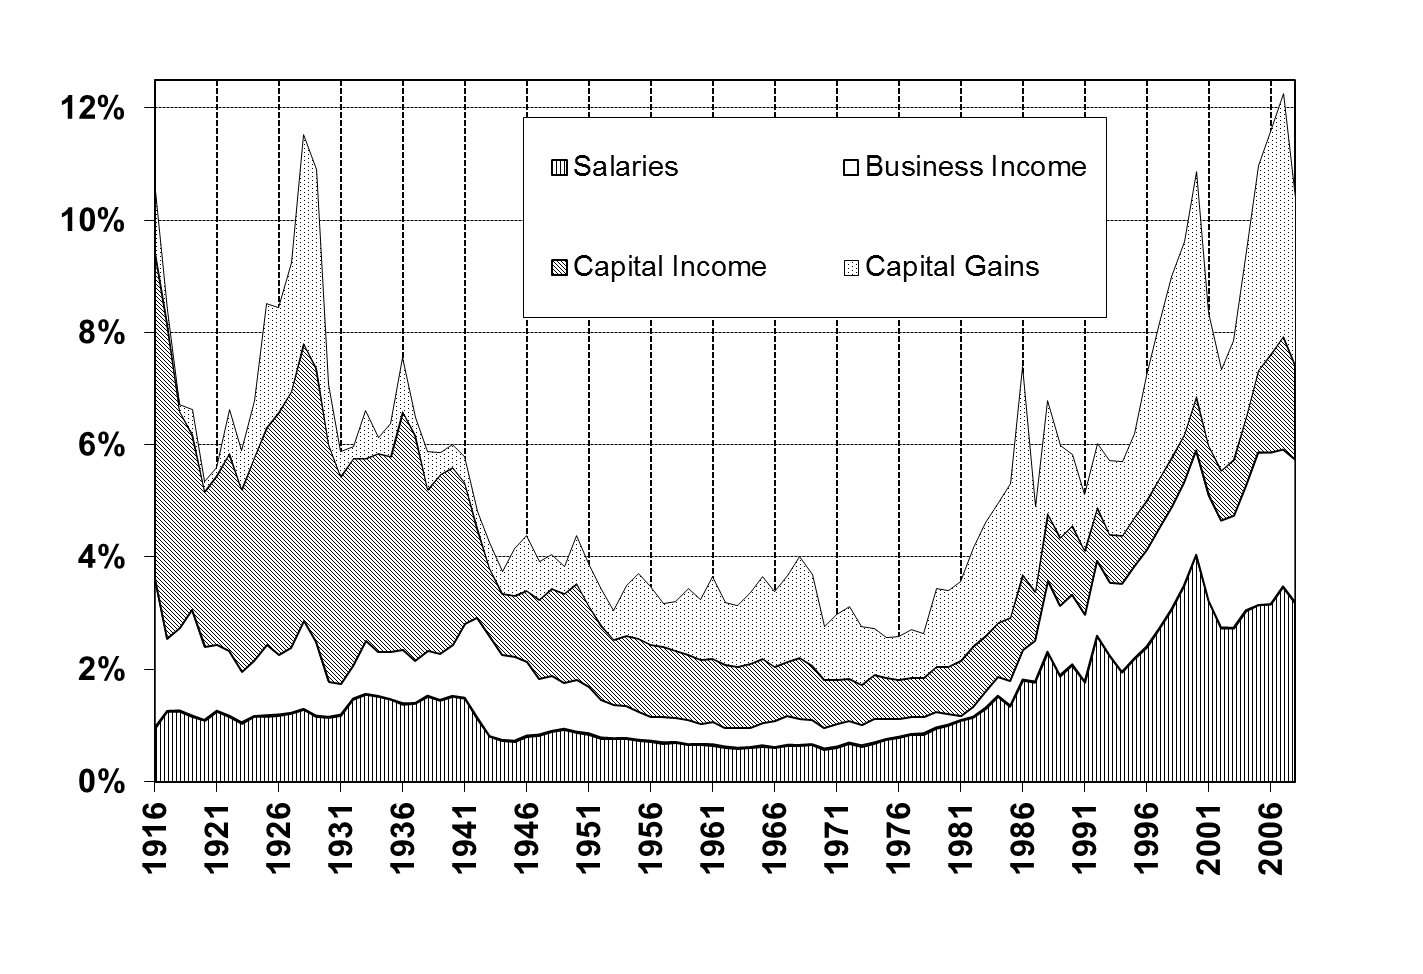
Growth of income at the top was a growth in salaries and business income. In other words, the impact of capital gains at the beginning of the 20th century was not as important once the economy took off in the late 80's.
The dynamic nature of the income distribution is acknowledged by Saez:
Such an abrupt decline, concentrated exactly during the war years, cannot easily be reconciled with slow technological changes and suggests instead that the shock of the war played a key and lasting role in shaping income concentration in the United States.
The realization that some trends are not explainable
would seem to strongly suggest that it is a very dynamic situation
in terms of what drives income distribution.
Links:
Forces Catalog: driving forces on income distribution.
Forces operating on Poor
Forces affecting income
Lists of causes affecting income distribution
Can Equality be good or bad?
Gallup poll on redistribution
Rich and how they educate
Myth of inequality
Real Unemployment and Sources of Income
Manufacturing Skills Crisis
Saez report: 2008
Who Rules America
IRS on tax code effects
Saez 2008 report:
Most strikingly, at the very top, the Absolute Return+Alpha magazine survey of the top 25 hedge fund managers shows that their profits plummeted from $22.5bn in 2007 to $11.6bn in 2008 but then more than doubled to $25.3bn in 2009 hence surpassing the previous 2007 peak. However, evidence from company filings shows that CEO compensation has continued to drop from 2008 to 2009 among the largest US companies.2
2 For example, according to Forbes, average CEO pay among the Fortune 500 companies (largest 500 US companies) was $11.7m in 2005, $15.8m in 2006, $12.9m in 2007, $11.4m in 2008, and $8m in 2009.
The Equilar survey published by the New York Times shows that median CEO pay
among the 200 largest firms (for which data was available) dropped by 6%
in 2008 and then 13% in 2009.
Interesting comment about being either a capitalist or a salaried person. The recent dramatic rise in income inequality in the United States is well documented. But we know less about which groups are winners and which are losers, or how this may have changed over time.
Is most of the income growth being captured by an extremely small income elite? Or is a broader upper middle class profiting? And are capitalists or salaried managers and professionals the main winners?
Efforts at analyzing long-term trends are often hampered by a lack of good data. In the United States, and most other countries, household income surveys virtually did not exist prior to 1960. The only data source consistently available on a long-run basis is tax data.
We exclude government transfers such as Social Security retirement benefits or unemployment compensation benefits from our income definition. Therefore, our income measure is defined as market income before individual income taxes.
The description of the bathtub curve in income from early 1900s to 2008 for the top 1%. Figure 1 presents the income share of the top decile from 1917 to 2008 in the United States. In 2008, the top decile includes all families with market income above $109,000.
The overall pattern of the top decile share over the century is U-shaped. The share of the top decile is around 45 percent from the mid-1920s to 1940. It declines substantially to just above 32.5 percent in four years during World War II and stays fairly stable around 33 percent until the 1970s.
Such an abrupt decline, concentrated exactly during the war years,
cannot easily be reconciled with slow technological changes and suggests
instead that the shock of the war played a key and lasting role in
shaping income concentration in the United States.
After decades of stability in the post-war period, the top decile share has increased dramatically over the last twenty-five years and has now regained its pre-war level. Indeed, the top decile share in 2007 is equal to 49.7 percent, a level higher than any other year since 1917 and even surpasses 1928, the peak of stock market bubble in the “roaring” 1920s. In 2008, the top decile share fell to 48.2 percent, approximately, its 2005 level, and is still higher than any other year before 2005 (except for 1928).
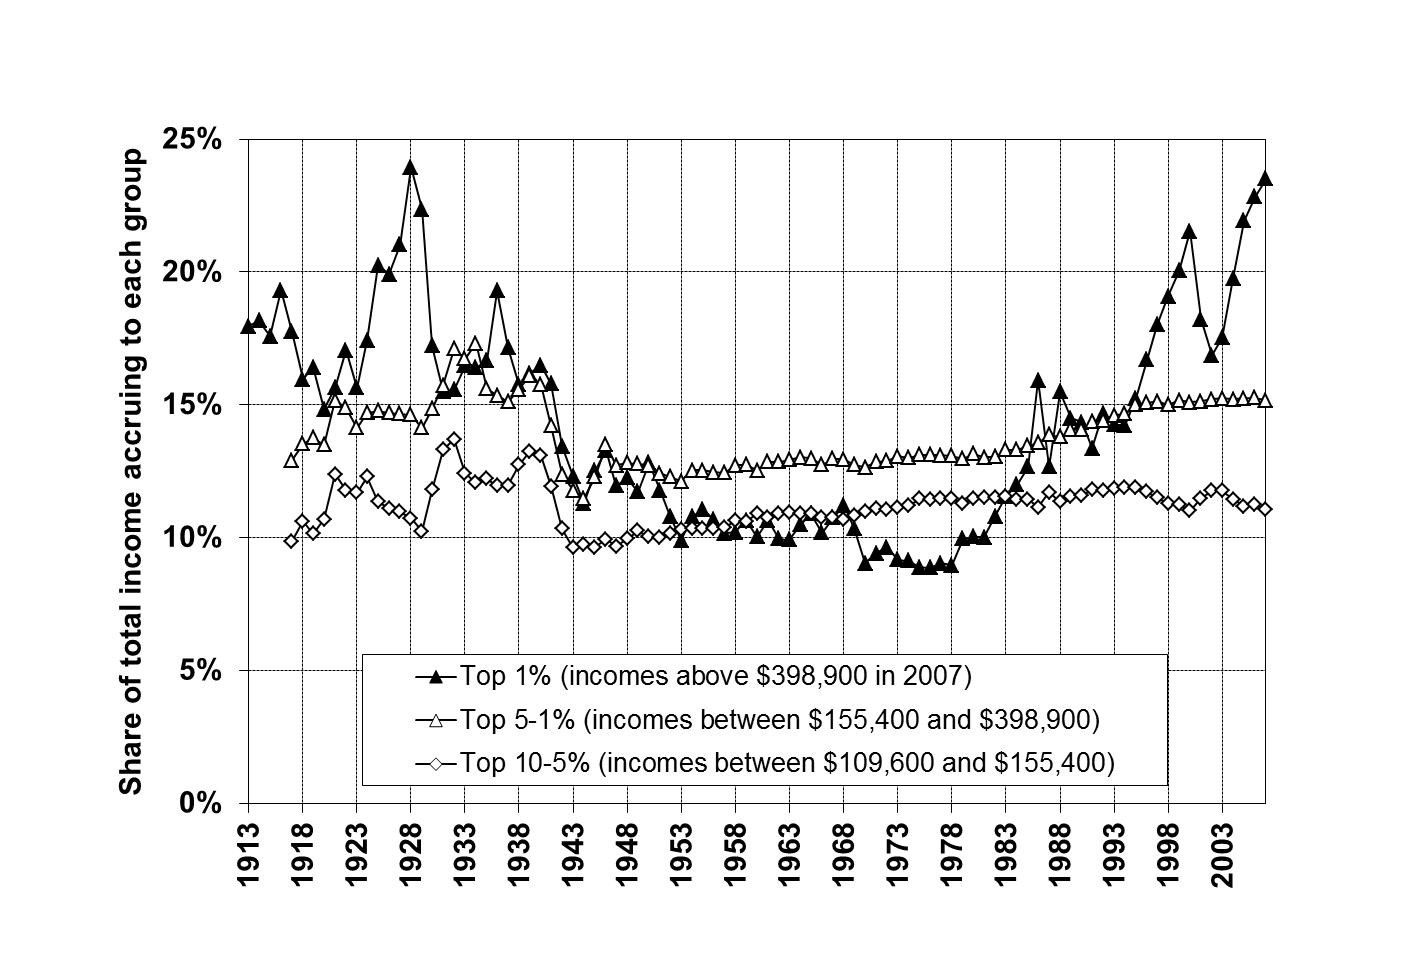
Comparison to the % just below the top 1% shows that they do not gain as much: Figure 2 decomposes the top decile into the top percentile (families with income above $368,000 in 2008) and the next 4 percent (families with income between $153,000 and $368,000 in 2008), and the bottom half of the top decile (families with income between $109,000 and $153,000 in 2008). Interestingly, most of the fluctuations of the top decile are due to fluctuations within the top percentile. The drop in the next two groups during World War II is far less dramatic, and they recover from the WWII shock relatively quickly.
Finally, their shares do not increase much during the recent decades. In contrast, the top percentile has gone through enormous fluctuations along the course of the twentieth century, from about 18 percent before WWI, to a peak to almost 24 percent in the late 1920s, to only about 9 percent during the 1960s-1970s, and back to almost 23.5 percent by 2007, and then to 20.9 percent in 2008. Those at the very top of the income distribution therefore play a central role in the evolution of U.S. inequality over the course of the twentieth century.
And the effect upon the bottom 99%:
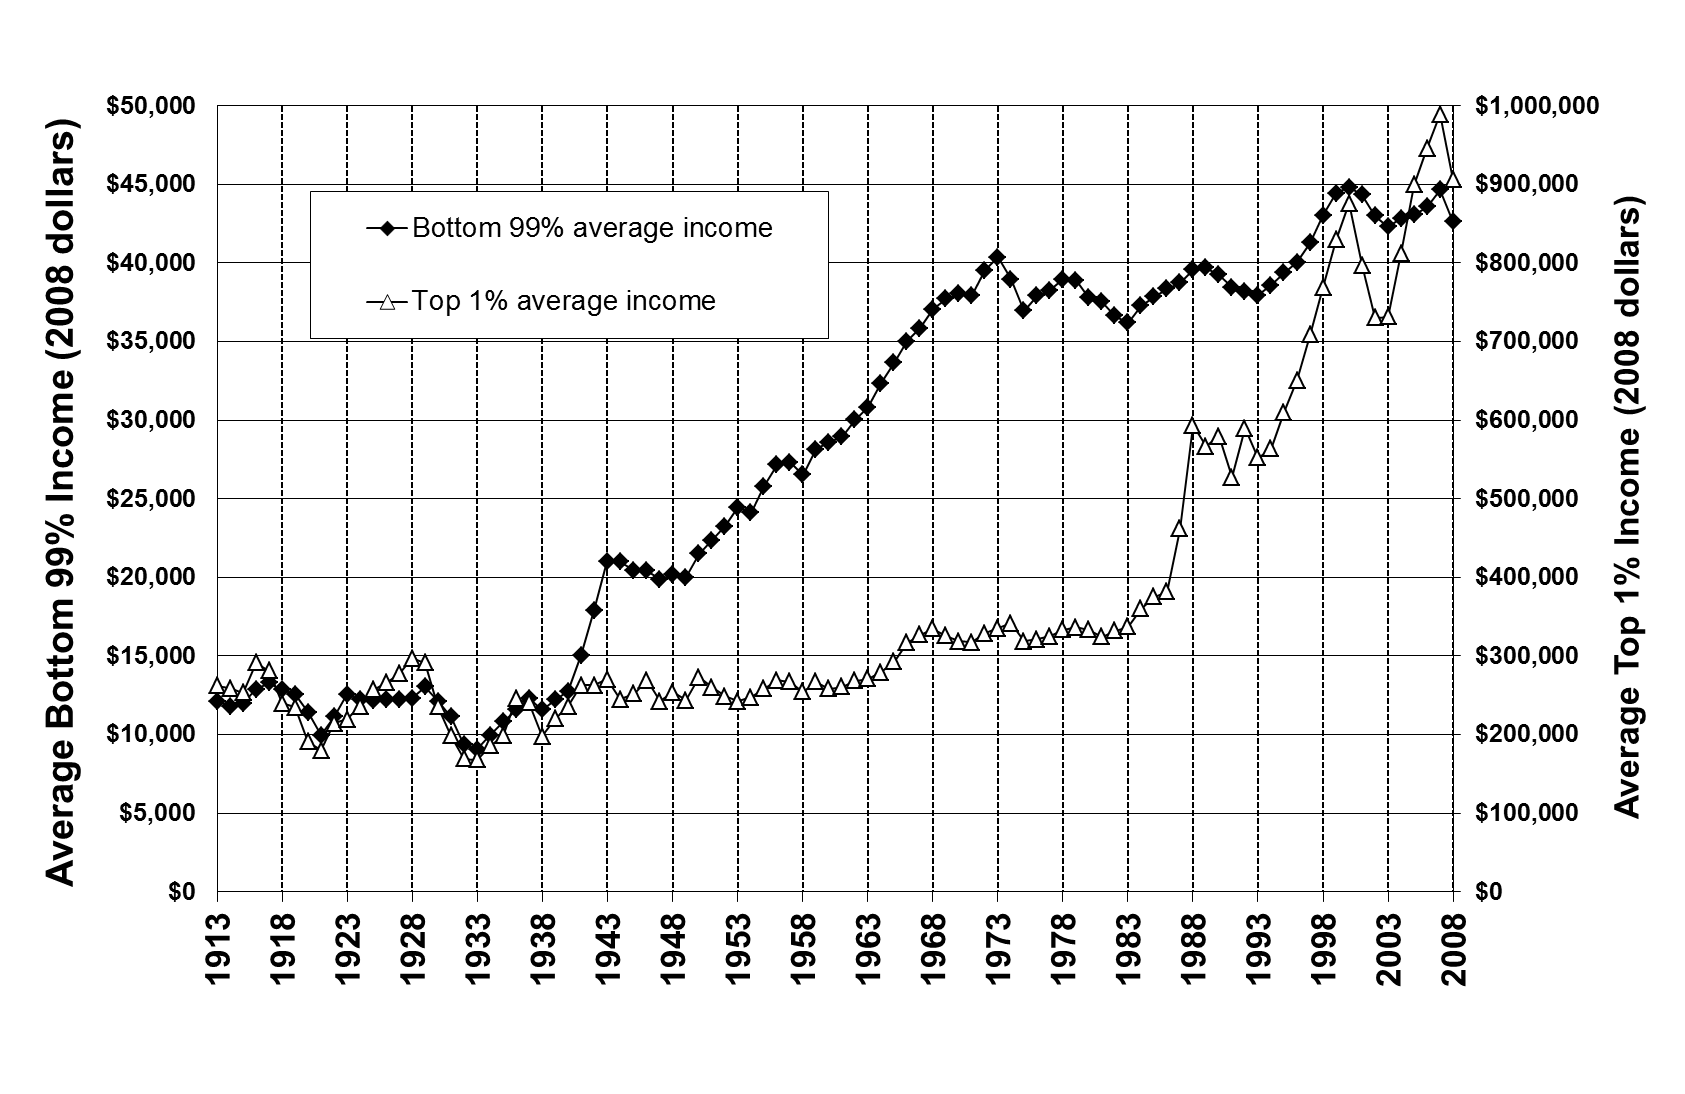
The 1993–2008 period encompasses, however, a dramatic shift in how the bottom 99 percent of the income distribution fared. Table 1 next distinguishes between four sub-periods:
(1) the 1993–2000 expansion of the Clinton administrations,
(2) the 2000-2002 recession,
(3) the 2002-2007 expansion of the Bush administrations, and
(4) 2007-2008, the first year of the Great recession.
During both expansions, the incomes of the top 1 percent grew extremely quickly at an annual rate over 10.3 and 10.1 percent respectively.
However, while the bottom 99 percent of incomes grew at a solid pace of 2.7 percent per year from 1993–2000, these incomes grew only 1.3 percent per year from 2002–2007. As a result, in the economic expansion of 2002-2007, the top 1 percent captured two thirds of income growth.
Overall comments shows his bias towards more taxes, Gov.:
The evidence suggests that top incomes earners today are not “rentiers” deriving their incomes from past wealth but rather are “working rich,” highly paid employees or new entrepreneurs who have not yet accumulated fortunes comparable to those accumulated during the Gilded Age.
The evidence suggests that top incomes earners today are not “rentiers” deriving their incomes from past wealth but rather are “working rich,”
highly paid employees or new entrepreneurs who have not yet accumulated fortunes comparable
to those accumulated during the Gilded Age.
to those accumulated during the Gilded Age.