For Rich or Poor: Reason, Jan 2012
On Income Distribution lately:
Veronique de Rugy writes in Reason:
Top 1% went from 23% of total income in 2007 to 17% in 2009.
A tiny 6 percent, or 38,000 people, retained their millionaire status for all nine years. In other words, most top earners are likely to lose their membership in the millionaires club.
The bottom line is that rising income inequality, while alarming at first glance, isn’t what it seems to be. The dynamism of the U.S. economy has been sadly underappreciated. Contrary to what most people believe, American households still experience considerable income mobility over time. That means more reasons to celebrate, and fewer reasons to pitch a tent at Occupy Wall Street.
From Millionaires to Poor - the mobility is pretty
noteworthy.
Links:
Pew Report: Mobility
Congress on Mobility
Mobility before 1996
Mobility from 1980
Mobility from 1995 to 2005
Middle Class: effects on mobility
Treasury Report on Mobility
Veronique in Reason, Jan 2012: Link
There is plenty of evidence that the richest Americans are richer than the richest Americans of the past. For instance, the top 1 percent of income earners in 1990 made 14 percent of Adjusted Gross Income (AGI), or pre-tax income, versus 23 percent in 2007—the second highest figure on record. The top 1 percent of households in 2007 made 275 percent more money adjusted for inflation than the top 1 percent in 1979, according to an October report from the Congressional Budget Office, while incomes in the bottom 20 percent increased by just 18 percent.
But ending the data in 2007 obscures the fact that the wealthiest 1 percent took a sizeable hit after the financial crisis, reducing their share of Adjusted Gross Income to 17 percent in 2009. As economist Steven Kaplan of the University of Chicago explained to George Mason University economist Russ Roberts in a recent EconTalk podcast,
“Recessions are bad for the rich. If you care
about inequality per se, recessions are great.”
 Kaplan also noted that
in 2009, the rich had a smaller share of income than they did at any
point during Bill Clinton’s second term, often cited as a period of
significantly greater income equality.
Kaplan also noted that
in 2009, the rich had a smaller share of income than they did at any
point during Bill Clinton’s second term, often cited as a period of
significantly greater income equality.
But even if the top 1 percent were still pulling down one-fifth of national income, this doesn’t mean that the remaining 99 percent are worse off, contrary to popular belief. Rather, as Kaplan correctly observed, “Income is not a zero-sum game. Somebody else’s income does not come at your expense. It could…but in general these numbers don’t have automatic implications for the 99 percent.” These kinds of comparisons don’t tell us anything about the absolute conditions of lower income earners.
But even if the top 1 percent were still pulling down one-fifth of national income, this doesn’t mean that the remaining 99 percent are worse off, contrary to popular belief. Rather, as Kaplan correctly observed, “Income is not a zero-sum game. Somebody else’s income does not come at your expense. It could…but in general these numbers don’t have automatic implications for the 99 percent.” These kinds of comparisons don’t tell us anything about the absolute conditions of lower income earners.
For instance, even though the lower earners have a smaller share of income today than they did in 1990, their absolute income is higher. A smaller share of a larger national pie can still mean more income than the bigger slice of a smaller pie. This is true even after you consider growth in population. According to IRS statistics, in 1990, the bottom 50 percent of income earners reported 15 percent of real adjusted gross income, some $517 billion in pre-tax income. In 2007, they reported only 12 percent of AGI, but this percentage amounted to more absolute dollars—some $1.1 trillion in pre-tax income.
But even these figures miss a more fundamental point. The top 1 percent in 1990 are not necessarily the same people as the top 1 percent in 2012. Data describing comparative income performance generally do not take into account the movement of individual households through time. There is no accurate assessment of the income gap without accounting for income mobility. The more the mobility, the less the significance of widening income disparities.
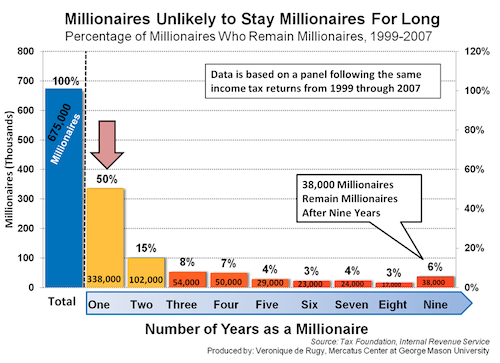
So what does that mobility look like? Take the top earners in
America. Using IRS data, the Tax Foundation has shown that of
the 675,000 taxpayers who reported $1 million in pre-tax income at some
point between 1999 and 2007, only about half remained millionaires just
one year later (see figure).
A tiny 6 percent, or 38,000 people, retained their millionaire status for all nine years. In other words, most top earners are likely to lose their membership in the millionaires club.
And things look rosier at the bottom of income distribution, too. The same Tax Foundation analysis showed that about 60 percent of households that were in the lowest income quintile in 1999 had moved to a higher quintile by 2007. And about one-third of those in the lowest quintile moved to the middle quintile or higher. While it may be difficult to rise literally from rags to riches, there is still plenty of opportunity for Americans to climb up the income ladder.
So if upward mobility is so common, why are there still plenty of poor people in this country? In a recent video about income mobility hosted by the Institute for Humane Studies, economist Steven Horwitz of Saint Lawrence University explains: “Immigrants and young people entering the labor force come into that income distribution at low levels of income. They become the new poor when the old poor slowly move their way up.” Horwitz concludes that “even though a first glance at the data may make it seem as if the rich are getting richer and the poor are getting poorer, the reality of the United States in the early 21st century is that everyone is getting richer, poor and rich alike.”
Even better news: The American Dream is still alive. Most children
are living better lives than their parents did before them.
A 2008 Pew Economic Mobility Project study by Brookings Institution scholars Julia Isaacs, Isabel Sawhill, and Ron Haskins showed that two-thirds of 40-year-old Americans are in households with larger incomes than their parents had at the same age. That remains true even after controlling for the rising cost of living. And if anything, this finding understates the progress we have made. Household size has declined in recent decades, meaning that incomes are now divided up between fewer family members, leaving each of them better off than the larger households of the past.
So why are people still sleeping outside in protest? Scott Winship of the Brookings Institution explained the paradox at National Review Online: “These accounts generally conflate disappointing growth in men’s earnings with growth in household income, which has been impressive. Growth in women’s earnings has also been impressive, but economic pessimists have twisted these bright spots to fit a gloomy narrative.”
The bottom line is that rising income inequality, while alarming at first glance, isn’t what it seems to be. The dynamism of the U.S. economy has been sadly underappreciated. Contrary to what most people believe, American households still experience considerable income mobility over time. That means more reasons to celebrate, and fewer reasons to pitch a tent at Occupy Wall Street.
A tiny 6 percent, or 38,000 people, retained their millionaire status for all nine years.
In other words, most top earners are likely to lose their membership in the millionaires club.